The 2-minute summary
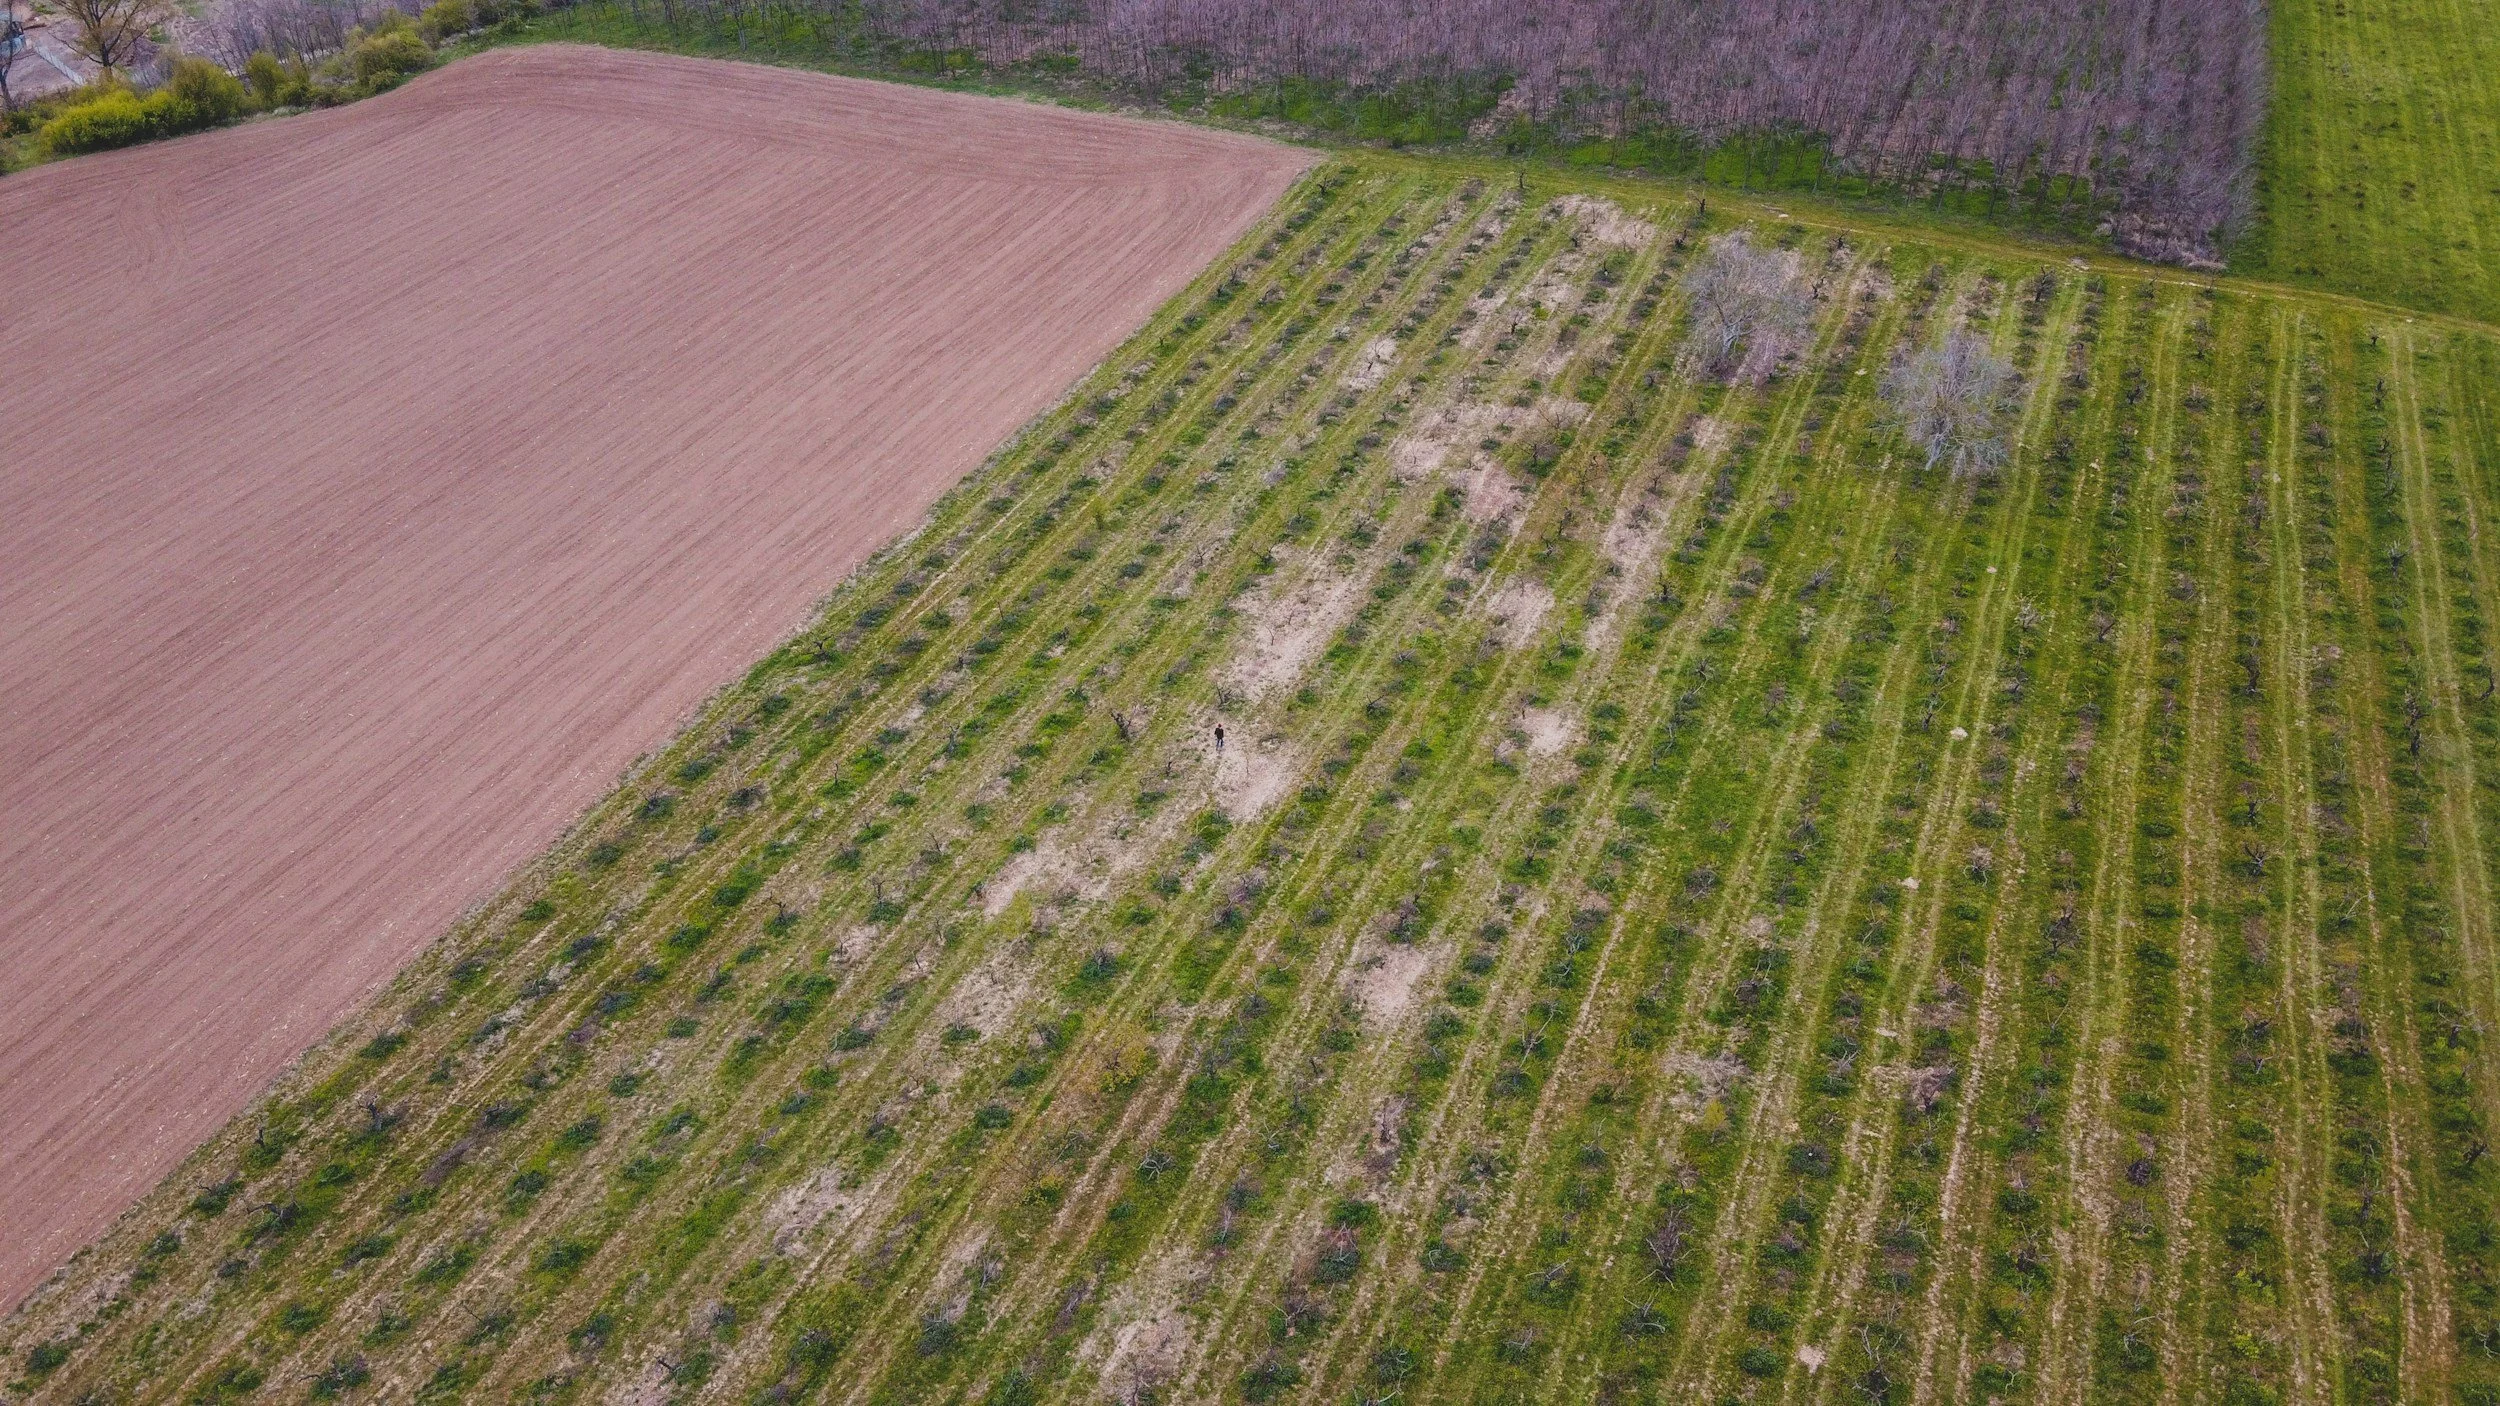
Crop insurers don't insure weather—they insure yields. Two neighboring fields can experience the same rainfall and temperature yet produce very different outcomes because of differences in soil, drainage, management practices, and crop genetics.
That’s why agricultural risk modeling is more than a weather-prediction exercise. Models must factor in management practices, field characteristics, and precise weather data to produce accurate predictions.
Field-level yield data derived from satellite imagery supports agricultural risk modeling by filling in data gaps. This helps insurers:
Improve pricing and underwriting with field-level production history
Understand emerging production risks to support reserve planning, capital allocation, reinsurance discussions, and portfolio management throughout the growing season
Expand into new agricultural markets without local infrastructure
Crop insurance carriers are under constant pressure to improve loss ratios, enter new markets, and allocate capital more efficiently. To do that, they need better agricultural risk models.
Satellite imagery and machine learning have attracted significant attention because they promise to fill long-standing gaps in agricultural data. But many emerging data sources still produce models that overlook important drivers of production risk.
Agrograph was built to address three of the biggest challenges in agricultural risk modeling.
Most Remote Sensing Models Predict Crop Conditions — Not Production
Many remote sensing products estimate vegetation, biomass, soil moisture, or weather conditions. Those measurements are useful, but they are not the outcome crop insurers ultimately care about.
Crop insurance protects yields.
Many machine learning models rely on weather observations or vegetation indices such as NDVI because they lack access to reliable production data. The result is a model that predicts crop conditions rather than crop performance.
Weather explains only part of agricultural risk. Two neighboring fields can experience the same rainfall and temperature yet produce very different yields because of differences in crop genetics, planting dates, irrigation, soil characteristics, and management practices. Similarly, NDVI scores can make a plant appear healthy even if it has endured stressors that will negatively impact yields.
Instead of focusing on these proxies, Agrograph combines satellite imagery with climate observations and proprietary machine learning models to estimate field-level yields directly.
Our models can reconstruct a field's production history, identify crop rotations, evaluate the hazards that affected production, and detect management practices that influence yield. The result is a much more complete picture of agricultural risk than weather or vegetation data can provide on their own.
Historical Production Data Is Scarce
Reliable historical production data is the foundation of any agricultural risk model. Unfortunately, that data is often unavailable.
In many parts of the world, field-level production records simply do not exist. Where production statistics are available, they are usually reported only at the county or district level. Those averages conceal substantial differences between neighboring fields caused by soil conditions, topography, drainage, irrigation, management practices, and localized weather events.
Even when insurers have access to farm-level records, they often rely on producer-supplied data. That creates the potential for adverse selection and inconsistent reporting.
Satellite imagery changes that equation by providing an objective historical record that neither insurers nor producers can influence.
Agrograph combines decades of satellite observations with machine learning to estimate historical production at the individual field level, giving insurers consistent data across regions where traditional records are incomplete or unavailable.
Better Machine Learning Requires Better Ground Truth
Machine learning models are only as accurate as the data used to train them.
Most publicly available agricultural datasets are either too coarse to capture meaningful field-level variation or rely on indirect indicators of production. Models trained on those datasets inherit the same limitations.
Agrograph addresses both problems with proprietary ground-truth data collected from more than 85,000 unique fields representing over 12 million acres across 24 growing seasons. Those observations have been verified by agronomists and allow our models to learn the relationship between satellite observations and actual production outcomes rather than relying on weather trends or vegetation indices alone.
That foundation enables more reliable yield predictions across diverse crops, management practices, and growing environments around the world.
Three Ways Better Risk Models Benefit Crop Insurers
Risk modeling affects more than the underwriting process in agricultural insurance. Accessing more accurate sources of crop production data can help crop insurers maximize profits while keeping prices competitive and protecting their policyholders.
Improve Pricing and Underwriting
Crop insurance policies are repriced every year, giving insurers an opportunity to refine underwriting assumptions and improve portfolio performance.
Field-level production history provides a much clearer understanding of risk than county averages. Instead of treating every farm within a county as equivalent, insurers can evaluate how soil conditions, management practices, hazard exposure, and historical yield variability influence production at the individual field level.
More accurate production data leads to better pricing decisions, stronger underwriting models, and improved loss ratios.
Enter New Markets and Launch New Products
Expanding into new agricultural markets has traditionally required extensive local infrastructure and reliable historical production records.
Satellite-derived field-level yield estimates remove much of that barrier.
Agrograph provides historical production intelligence across more than 800 million hectares of cropland worldwide, allowing insurers to evaluate agricultural risk in regions where reliable local datasets are unavailable.
The same historical datasets also support the design, backtesting, and refinement of parametric insurance products by helping insurers develop triggers that are grounded in decades of observed production outcomes.
Monitor Portfolio Risk Throughout the Season
Agricultural risk changes throughout the growing season.
As weather events unfold, insurers need to understand emerging production risks to support reserve planning, capital allocation, reinsurance discussions, and portfolio management.
Agrograph's in-season yield predictions provide early directional signals about production outcomes and become more accurate as harvest approaches. That gives insurers an earlier view of portfolio exposure than traditional production reporting, which can lead to better loss estimates for financial reserves (also known as claims reserving.) Being able to accurately predict losses ahead of time means investment decisions can be made based on real data, not a guess.
Improve Crop Insurance Risk Modeling with Better Production Data
Agricultural risk modeling is often oversimplified as a weather-prediction exercise. But weather is just one part of the picture. The bigger goal is to predict how weather, management practices, and field characteristics will combine to affect agricultural production in any given area.
That’s why field-level production data is the key to improving crop insurance risk modeling.
Agrograph provides historical and in-season yield intelligence at the field level for more than 800 million hectares worldwide through APIs and customized data subscriptions.
Schedule a Discovery Call to learn how Agrograph can provide the historical production data to strengthen your agricultural risk models.