The 2-Minute Summary
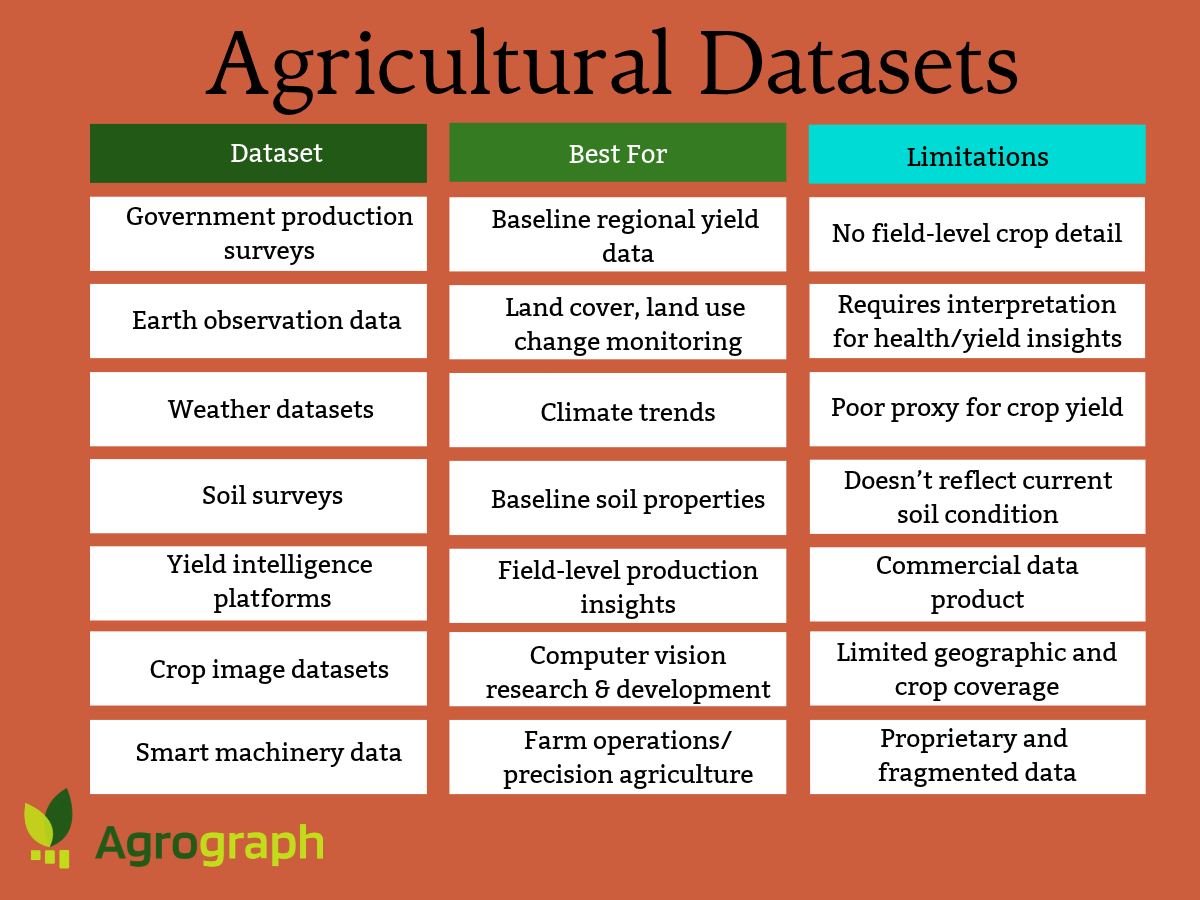
There are hundreds of publicly available datasets with potential agricultural applications, including research, reporting, or monitoring. This article discusses the applications and limitations of seven types of existing and emerging agricultural datasets that have the potential to help crop insurers gain a better understanding of production risk:
Government production surveys
Earth observation data
Weather datasets
Soil surveys
Yield intelligence platforms
Crop image datasets
Smart machinery data
If you want to calculate the risk of insuring an individual agricultural field, you need access to reliable agricultural datasets that offer locally specific insights on past production, weather conditions, soil type, and other influential factors.
While there are hundreds of publicly available datasets with potential agricultural applications, most of them have limited use for crop insurers on their own. Agricultural datasets that are developed by academic researchers, government reporting agencies, global food security initiatives, and volunteer data scientists usually lack the granularity or geographic coverage needed for localized production risk applications.
For example, the UN’s Food and Agricultural Organization collects global agricultural production data every year to ensure global food security. The public databases available on FAOSTAT can quickly tell you the average per acre yield of all corn farms in any given country for the past 30 years. But for crop insurance purposes, the FAOSTAT dataset isn’t very useful because it tells you nothing about the statistical or spatial distribution of that average yield — the highest and the lowest typical yields, and where those extremes are found.
Turning the geographically fragmented, poorly organized, and non-standardized datasets into actionable, reliable, granular insights for agricultural insurance providers takes both machine learning expertise and agronomic expertise. That’s where agricultural intelligence providers like Agrograph are emerging to help crop insurance teams answer questions that public survey data and raw satellite imagery can’t — questions that will help them price risk, launch new products, and identify opportunities.
Here’s an overview of seven types of existing and emerging agricultural datasets that have the potential to contribute to the development of new crop insurance products, technologies, and better understanding of risk.
Government Production Surveys
Government agencies around the world, such as the U.S. Department of Agriculture (USDA) and the U.N.’s Food and Agriculture Organization (FAO) collect agricultural production data via surveys. These surveys are typically done annually at the country level for each crop grown in that region, providing a baseline for yields in those geographies.
Examples include:
These datasets can help answer questions like, “How much corn did the world produce this year?” or “How much sugar will the largest producers in Brazil produce, and how will that affect markets?”
The applications of these datasets are limited by their lack of granular detail. The most detailed government production surveys only provide average yields for counties, with no information about the distribution of yield below the county level. Additionally, survey data is susceptible to both accidental errors and intentional exaggeration, which both weaken its reliability.
Earth Observation Data
Earth observation (EO) data includes optical, thermal infrared, microwave radar (SAR), multispectral, and hyperspectral observations collected by satellites. Since EO satellites have access to the entire globe and take pictures or measurements at regular intervals, the data available is consistent and free of human error. You can get the same image quality in Bangladesh as in Brazil without needing any local infrastructure.
Many of these datasets are available to the public free of charge for any purpose from space agencies like NASA and ESA. Examples include:
ESA WorldCover: Using 10-meter spatial resolution imagery from the Sentinel satellite constellation, this map shows the location of all cropland in Europe.
Copernicus Land Monitoring Service: This dataset tracks land cover, land use changes, and other variables for Europe and the entire globe.
The EO datasets available to the public are helpful for identifying whether a parcel of land is cropland and monitoring land use changes over time. However, to get deeper agricultural insights, such as whether a parcel of land was planted this year, what crop was planted, and what yield that crop is likely to see this year, you need to do additional analysis with carefully refined machine learning models.
Weather Datasets
Weather and climate data for any location on the globe is widely available to the public through a combination of government and academic monitoring networks. Many of these networks offer historical weather data for free.
Examples include:
Insurance underwriters can use weather datasets to establish climate baselines and verify historical precipitation and temperature levels.
Some agricultural intelligence providers claim to be able to predict crop yield based on weather data alone. While weather has a huge impact on yield, on its own it’s a poor proxy because it doesn’t account for important factors like irrigation, soil quality, and management practices. However, for some agribusiness use cases, like grain trading, weather-based yield prediction models like CropProphet may provide useful signals.
Soil Data
National surveys of soil type (or soil quality) exist for most countries. Soil data is gathered by walking through fields, observing the soil, and analyzing samples in laboratories. Since soil type doesn’t change from year to year, these databases remain mostly static.
As an example, the Soil Survey Geographic Database (SSURGO) from USDA contains information about soil as collected by the National Cooperative Soil Survey over the course of a century.
Soil type often determines the upper and lower limits of the yield for a particular crop, so it’s an important input type for agricultural machine learning models. However, soil type datasets tell you nothing about the soil condition in a given season (moisture level, mineral content, organic material content, etc.), so on their own they can’t provide answers about in-season yield.
Yield Intelligence Data
An emerging source of actionable agricultural data is the growing field of crop yield intelligence. Machine learning models trained on sufficient ground truth data can turn satellite agricultural imagery into reliable in-season yield predictions.
At Agrograph, this is our focus. We have brought together agronomic expertise, machine learning expertise, and a proprietary ground truth dataset collected from more than 85,000 unique fields. Our crop yield dataset is available via API, so the data integrates directly into the mapping or analytics tool of your choice.
Using Agrograph data, you can answer questions that you can’t answer with public datasets, such as:
Was this field cultivated this year?
What was grown here?
What will its yield be this season?
These insights are helpful for crop insurance risk evaluation, land evaluation, and in-season yield prediction for agricultural suppliers and commodities traders.
Other agricultural yield intelligence platforms include:
Unlike public datasets, access to all of these platforms requires a subscription. However, subscriptions are typically customizable so that you only pay for the crops, geographies, and variables you care about.
Crop Image Datasets
Crop images are another valuable type of agricultural dataset available to researchers. Crop image datasets are primarily used to develop and benchmark computer vision algorithms for applications such as crop identification, disease detection, weed recognition, and agricultural robotics.
Crop vision datasets consist of thousands of labeled images of crops collected from drones or boots-on-the-ground efforts. The images showcase crops in a wide variety of lighting and health conditions. They’re most useful in early-stage academic research projects, where the goal is to train a model to identify objects.
One such dataset is the Crop Vision Dataset developed by researchers at the Beijing Technology and Business University.
Some open-source machine learning and data science communities like Kaggle or Github also offer crop image datasets for research uses, such as this Plant Diseases Detection image collection on Kaggle.
Unlike the other datasets in this article, crop image datasets are primarily intended for machine learning research rather than operational agribusiness decision-making. Since these datasets aren't linked to field-level production outcomes and aren’t time-series datasets, they have minimal value for predicting production outcomes and risk.
Smart Machinery Data
Thanks to the growing use of smart tractors in farms around the world, smart machinery engine data is emerging as another potential source of agricultural data. This data can be analyzed for patterns in many of the same ways as EO data. The engine data from a tractor that planted grass, for example, will have a different pattern than the same tractor when used to plant corn. This could offer an alternative to using satellite imagery to remotely identify which crops are planted where.
The John Deere Operations Center is a smart tractor brand that is currently collecting and analyzing engine data for potential agricultural applications.
Currently, this data is only available to John Deere employees or customers. Additionally, unlike satellite-based data sources, the data’s geographic coverage is limited by the distribution of the customer base.
Agrograph’s Agricultural Intelligence Turns Data into Insights
Public agricultural datasets offer useful information about farming, weather, soils, and land use. But on their own, these datasets have limited value for informing agribusiness decisions. Crop insurers need to understand production risk at the level of individual fields, not county averages.
That's where agricultural intelligence platforms like Agrograph fill the gap. By combining publicly available satellite imagery, weather records, soil surveys, and other environmental datasets with proprietary field-level ground truth and machine learning, Agrograph produces insights that don't exist in any public database. Instead of asking what happened across an entire county last year, users can ask whether a specific field was cultivated, what crop was planted, how much it produced historically, how much it is likely to produce this season, and how that production compares with similar fields nearby.
For crop insurers, that means more accurate pricing, underwriting, portfolio monitoring, and product development. For agricultural lenders, commodity traders, farmland investors, and geospatial software providers, it means making decisions based on field-level production intelligence rather than regional averages.
Contact Agrograph to learn how our agricultural datasets can help you better predict crop outcomes, assess risk, and monitor agricultural production across your portfolio.